图表
库
模板首页
在线编辑器
首页
/ 数据图表 / 桑基图
桑基图模板
Sankey Diagram
用分支宽度表达流量、资金或能量流向与分布的图表。流量从哪来、到哪去、损耗多少,桑基图一画便知。
数据分析
运营
商业计划书
浅色
深色
模板预览
CI compute budget · a month of pipeline minutes
Sankey diagram showing 12,000 monthly CI minutes splitting into unit test, E2E, build, and lint stages, then merging into passed, failed, and flaked outcomes, with the flaky-rerun path highlighted as the one accent flow.
BUDGET
TEST STAGE
OUTCOME
CI minutes
12,000 min
Unit tests
5,200 min
E2E
4,000 min
Build
2,000 min
Lint
800 min
Flaked
1,000 min
Passed
9,400 min
Failed
1,600 min
LEGEND
Flow · stage routing
Flaked path · reruns
Node · stage total
Two coral ribbons — flaky reruns burn ~8% of the monthly CI budget.
CI compute budget · a month of pipeline minutes
Sankey diagram showing 12,000 monthly CI minutes splitting into unit test, E2E, build, and lint stages, then merging into passed, failed, and flaked outcomes, with the flaky-rerun path highlighted as the one accent flow.
BUDGET
TEST STAGE
OUTCOME
CI minutes
12,000 min
Unit tests
5,200 min
E2E
4,000 min
Build
2,000 min
Lint
800 min
Flaked
1,000 min
Passed
9,400 min
Failed
1,600 min
LEGEND
Flow · stage routing
Flaked path · reruns
Node · stage total
Two coral ribbons — flaky reruns burn ~8% of the monthly CI budget.
在线编辑此模板
下载 SVG
相关图表模板
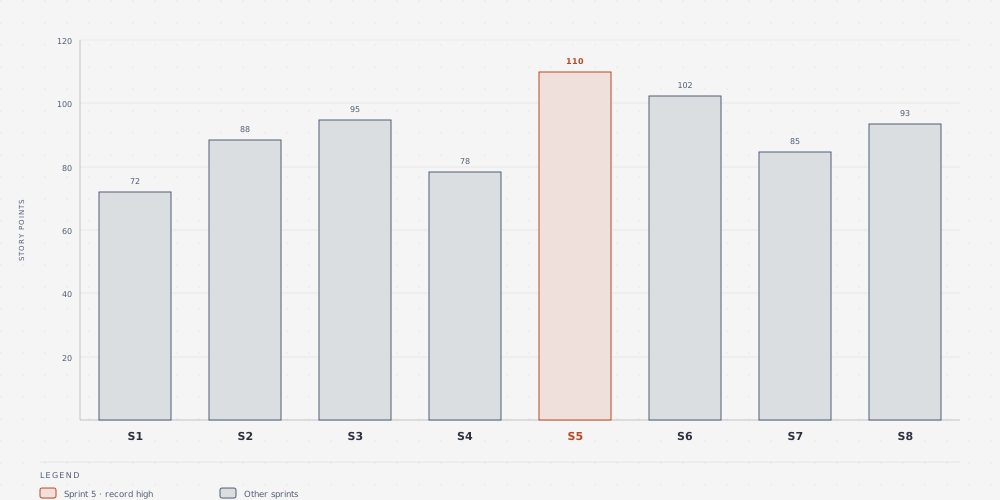
条形图
折线图
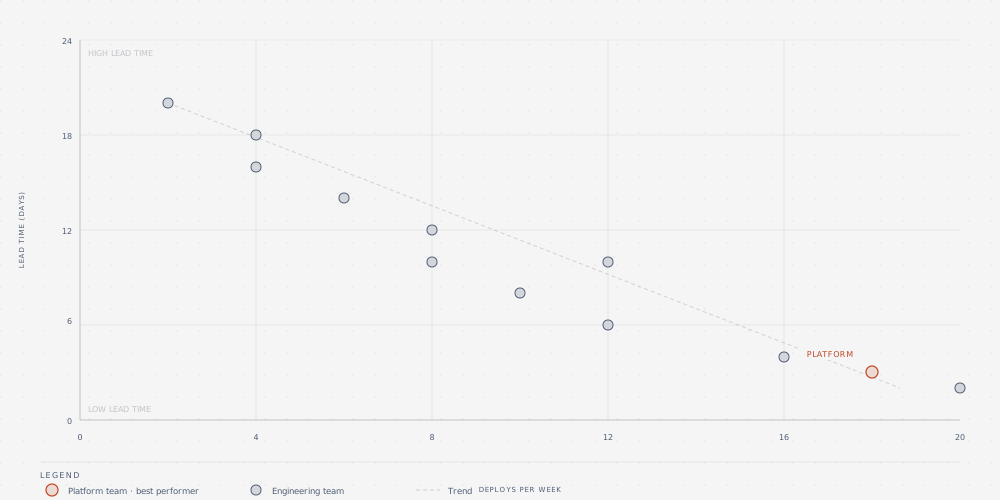
散点图
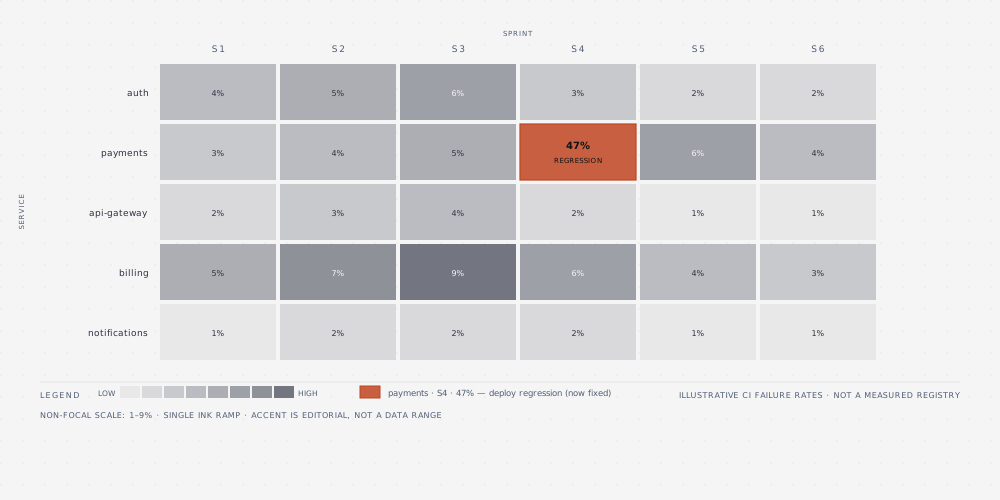
热力图
使用提示:在编辑器中可修改模板里的全部文字、替换配色,并导出 SVG(矢量无限放大)或 PNG(2 倍高清)用于文档、论文与演示文稿。