图表
库
模板首页
在线编辑器
首页
/ 数据图表 / 条形图
条形图模板
Bar Chart
用条形长度对比多组数值的经典图表,横向纵向皆可。数据分析报告、市场调研和学术论文中最常用的可视化形式之一,直观呈现数值差异。
数据分析
论文
市场调研
运营
浅色
深色
模板预览
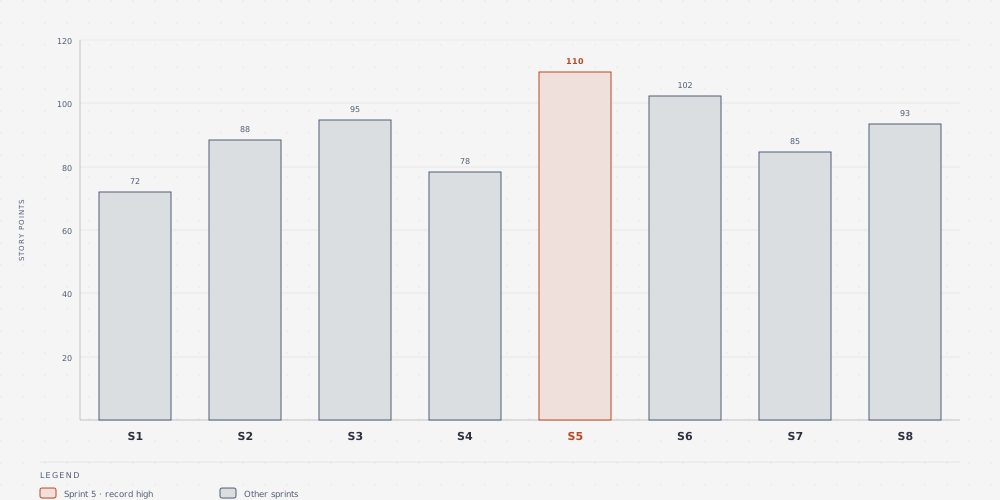
Sprint velocity · 8-sprint view
Bar chart showing story points delivered across sprints S1 through S8, with Sprint 5 as the record high.
STORY POINTS
20
40
60
80
100
120
72
88
95
78
110
102
85
93
S1
S2
S3
S4
S5
S6
S7
S8
LEGEND
Sprint 5 · record high
Other sprints
Sprint velocity · 8-sprint view
Bar chart showing story points delivered across sprints S1 through S8, with Sprint 5 as the record high.
STORY POINTS
20
40
60
80
100
120
72
88
95
78
110
102
85
93
S1
S2
S3
S4
S5
S6
S7
S8
LEGEND
Sprint 5 · record high
Other sprints
在线编辑此模板
下载 SVG
相关图表模板
折线图
散点图
热力图
雷达图
使用提示:在编辑器中可修改模板里的全部文字、替换配色,并导出 SVG(矢量无限放大)或 PNG(2 倍高清)用于文档、论文与演示文稿。