图表
库
模板首页
在线编辑器
首页
/ 数据图表 / 极区图
极区图模板
Polar Chart
在极坐标系中用扇形表达周期性或方向性数据的图表。年度复盘、能力评估、市场份额对比,极区图让“全面开花”可视化。
数据分析
商业计划书
求职简历
浅色
深色
模板预览
Request demand by UTC window
Polar chart on a 0–100% scale identifying 12–15 UTC as the 100% peak, with the other seven UTC windows proceeding clockwise.
% OF DAILY PEAK · 0–100
20
40
60
80
100
0
00–03
32
03–06
18
06–09
24
09–12
58
12–15
100
15–18
82
18–21
76
21–24
45
Illustrative normalized workload profile
Request demand by UTC window
Polar chart on a 0–100% scale identifying 12–15 UTC as the 100% peak, with the other seven UTC windows proceeding clockwise.
% OF DAILY PEAK · 0–100
20
40
60
80
100
0
00–03
32
03–06
18
06–09
24
09–12
58
12–15
100
15–18
82
18–21
76
21–24
45
Illustrative normalized workload profile
在线编辑此模板
下载 SVG
相关图表模板
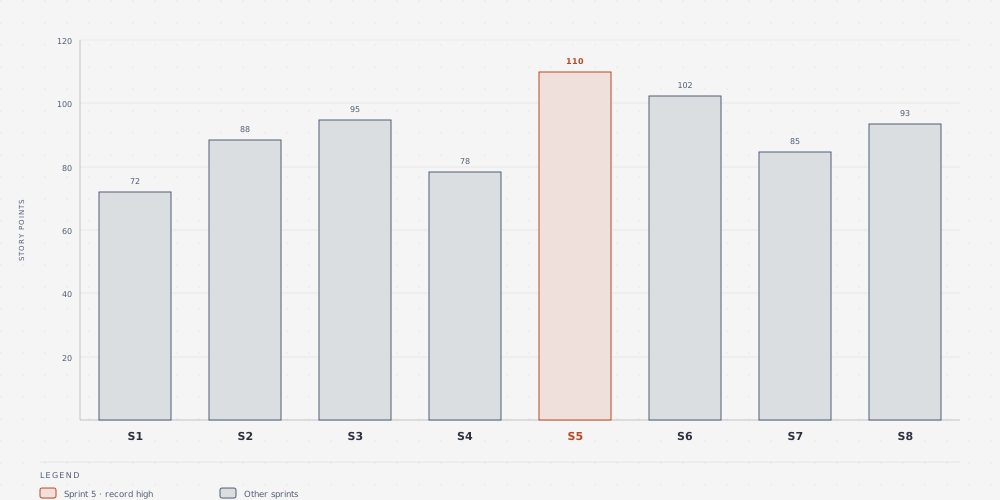
条形图
折线图
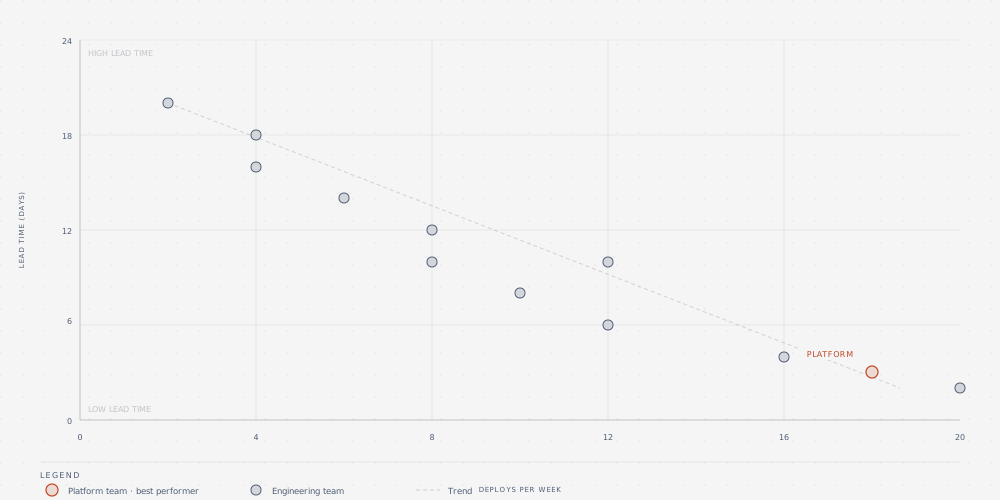
散点图
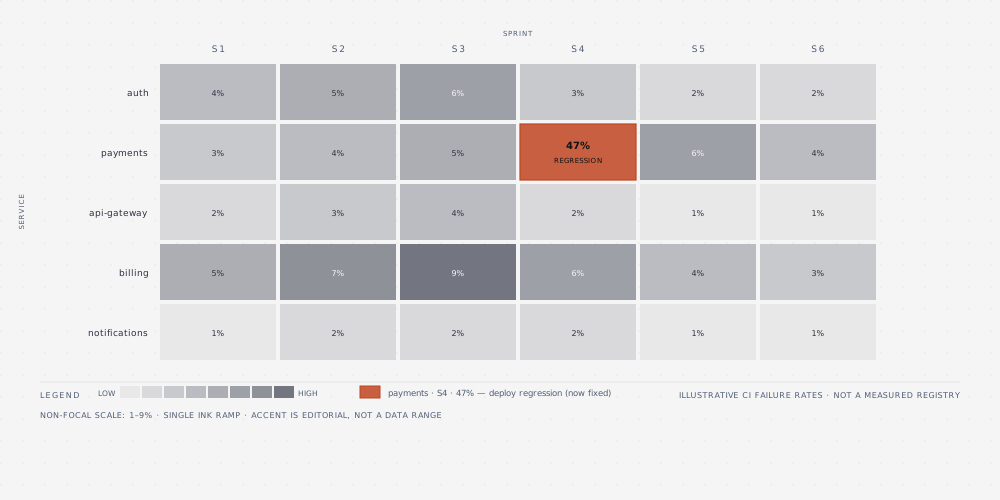
热力图
使用提示:在编辑器中可修改模板里的全部文字、替换配色,并导出 SVG(矢量无限放大)或 PNG(2 倍高清)用于文档、论文与演示文稿。